This class fills in map cell rectangles on a plot. More...
Public Member Functions | |
| XYSimpleCellRenderer () | |
| Constructor. More... | |
| void | drawItem (java.awt.Graphics2D g2, XYItemRendererState state, java.awt.geom.Rectangle2D dataArea, PlotRenderingInfo info, XYPlot plot, ValueAxis domainAxis, ValueAxis rangeAxis, XYDataset dataset, int series, int item, CrosshairState crosshairState, int pass) |
| Draws a single grid cell. More... | |
| void | setColor (int iRed, int iGreen, int iBlue, int iSeries) throws ModelException |
| Sets the fill color for a series. More... | |
| void | setColor (Color jColor, int iSeries) |
| Sets the fill color for a series. More... | |
| void | setXCellLength (float fLength) |
| Sets the X cell length. More... | |
| void | setYCellLength (float fLength) |
| Sets the Y cell length. More... | |
| Color | getColor (int iSeries) |
| Gets the color for a series. More... | |
| Paint | GetSeriesPaint (int iSeries) |
| Returns the color for a series. More... | |
Private Attributes | |
| float | m_fXCellSize = 8 |
| Length of each cell in the X direction, in meters. More... | |
| float | m_fYCellSize = 8 |
| Length of each cell in the Y direction, in meters. More... | |
| org.jfree.util.PaintList | m_jPaintList = new org.jfree.util.PaintList() |
| The paint list. More... | |
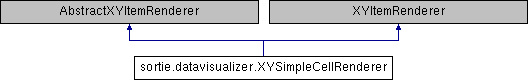
Detailed Description
This class fills in map cell rectangles on a plot.
The rectangle size can be set; the size defaults to the same as the underlying grid size.
The X and Y are expected to be integers which equal cell numbers in the X and Y directions. The Z is expected to be a number which controls the presence or absence of fill in a cell. true means fill; false means don't fill. Each filled cell is filled in the same color. A non-filled cell is not filled in white; it is not filled at all, which will allow anything underneath to show through.
The color can be controlled by setting the RGB value.
Originally this task was performed by XYCellRenderer. But then JFreeChart upgraded and took away my only way to find out if a cell was not to be filled, so I made this class for subplots, and simplified it for the job while I was at it.
Copyright: Copyright (c) Charles D. Canham 2003
Company: Cary Institute of Ecosystem Studies
- Version
- 1.0
Edit history:
---------------—
December 21, 2006: Created (LEM)
February 4, 2008: Updated to conform to Java 6 compliance (LEM)
Constructor & Destructor Documentation
◆ XYSimpleCellRenderer()
| sortie.datavisualizer.XYSimpleCellRenderer.XYSimpleCellRenderer | ( | ) |
Constructor.
Sets defaults.
Member Function Documentation
◆ drawItem()
| void sortie.datavisualizer.XYSimpleCellRenderer.drawItem | ( | java.awt.Graphics2D | g2, |
| XYItemRendererState | state, | ||
| java.awt.geom.Rectangle2D | dataArea, | ||
| PlotRenderingInfo | info, | ||
| XYPlot | plot, | ||
| ValueAxis | domainAxis, | ||
| ValueAxis | rangeAxis, | ||
| XYDataset | dataset, | ||
| int | series, | ||
| int | item, | ||
| CrosshairState | crosshairState, | ||
| int | pass | ||
| ) |
Draws a single grid cell.
If the Z value is not true, nothing is drawn.
- Parameters
-
g2 - the graphics device. state - the renderer state. dataArea - the area within which the data is being rendered. info - collects drawing info. plot - the plot. domainAxis - the domain axis. rangeAxis - the range axis. dataset - the dataset. series - the series index (zero-based). item - the item index (zero-based). crosshairState - crosshair information for the plot (null permitted). pass - the pass index.
◆ getColor()
| Color sortie.datavisualizer.XYSimpleCellRenderer.getColor | ( | int | iSeries | ) |
Gets the color for a series.
- Parameters
-
iSeries The series to get the color for.
- Returns
- The color.
◆ GetSeriesPaint()
| Paint sortie.datavisualizer.XYSimpleCellRenderer.GetSeriesPaint | ( | int | iSeries | ) |
Returns the color for a series.
If the series has not been explicitly set, it returns the default.
- Parameters
-
iSeries the series index (zero-based).
- Returns
- The paint.
◆ setColor() [1/2]
| void sortie.datavisualizer.XYSimpleCellRenderer.setColor | ( | int | iRed, |
| int | iGreen, | ||
| int | iBlue, | ||
| int | iSeries | ||
| ) | throws ModelException |
Sets the fill color for a series.
- Parameters
-
iRed The RGB red value, between 0 and 255. iGreen The RGB green value, between 0 and 255. iBlue The RGB blue value, between 0 and 255. iSeries The series to set the color for.
- Exceptions
-
sortie.data.simpletypes.ModelException if the rgb values are invalid.
◆ setColor() [2/2]
| void sortie.datavisualizer.XYSimpleCellRenderer.setColor | ( | Color | jColor, |
| int | iSeries | ||
| ) |
Sets the fill color for a series.
- Parameters
-
jColor Color to set. iSeries Series for which to set the color.
◆ setXCellLength()
| void sortie.datavisualizer.XYSimpleCellRenderer.setXCellLength | ( | float | fLength | ) |
Sets the X cell length.
- Parameters
-
fLength X cell length, in m.
◆ setYCellLength()
| void sortie.datavisualizer.XYSimpleCellRenderer.setYCellLength | ( | float | fLength | ) |
Sets the Y cell length.
- Parameters
-
fLength Y cell length, in m.
Member Data Documentation
◆ m_fXCellSize
|
private |
Length of each cell in the X direction, in meters.
◆ m_fYCellSize
|
private |
Length of each cell in the Y direction, in meters.
◆ m_jPaintList
|
private |
The paint list.
The documentation for this class was generated from the following file: